Vertiv (VRT): Quantifying the “Thermal Moat”
Why a $6 Billion Backlog Matters More Than P/E Ratios

Last week, we established the macro problem: The TWh Gap.
We know the grid is constrained. We know AI chips run hot. We know the demand for power is vertical.
But as investors, we don’t buy “themes”—we buy stocks.
The obvious trade was Nvidia. But the “Systematic” trade is to look for the bottleneck after the chip. That leads us directly to Vertiv (VRT).
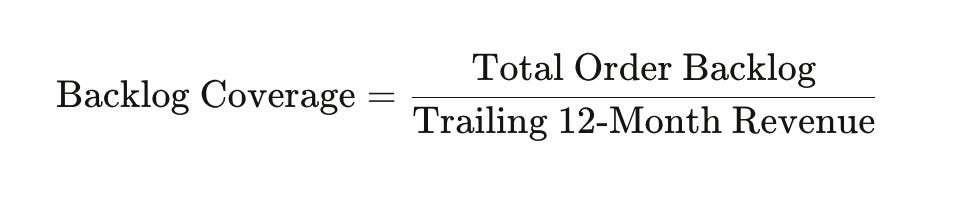
While analysts argue about P/E ratios, I want to look at a metric that actually quantifies revenue visibility: The Backlog Coverage Ratio.
The Narrative: The “Cisco” of Thermodynamics
If Nvidia is the brain of AI, Vertiv is the lungs.
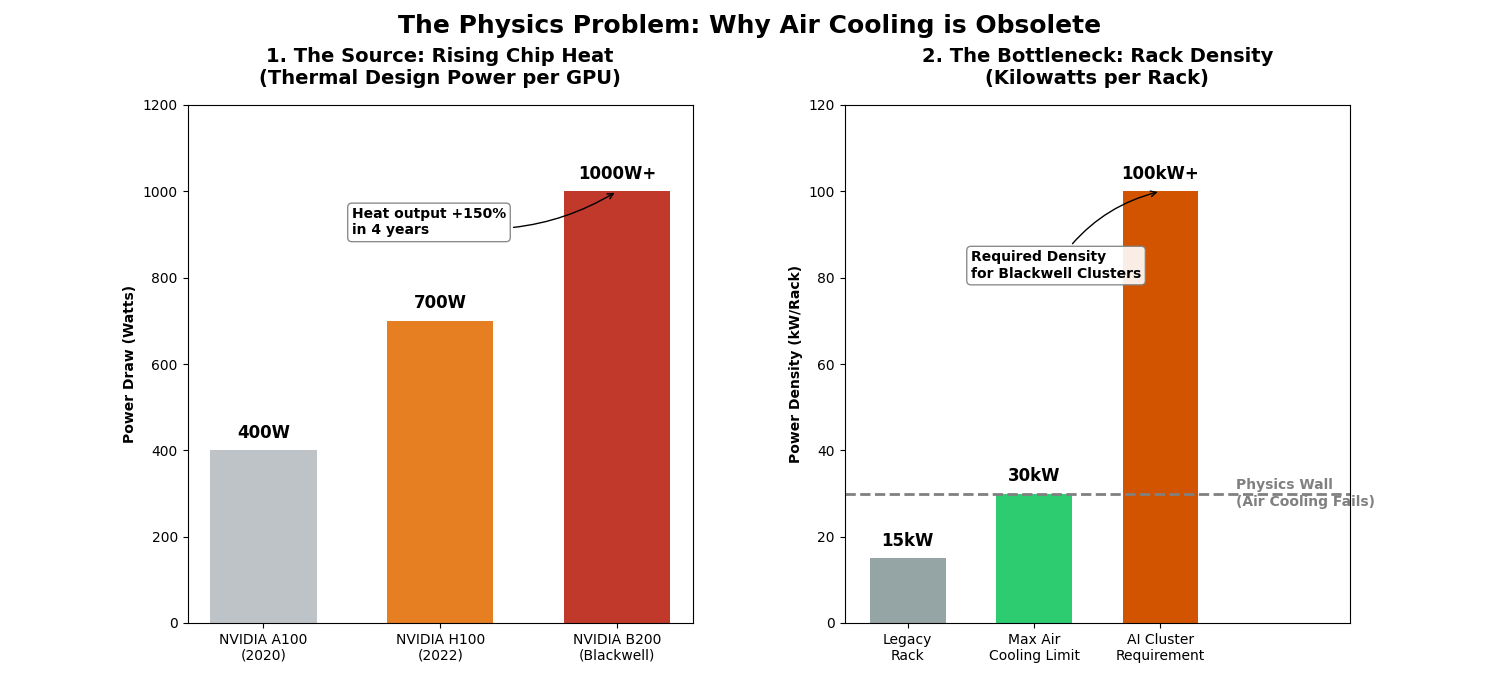
As we discussed in the TWh Gap, an H100 chip draws approximately 700W. The upcoming Blackwell chips will draw even more, some estimates suggest power consumption could reach 1000W per chip. You cannot cool these densities with standard air conditioning. The physics simply don’t allow it. You need liquid cooling, immersion cooling, and high-density power management systems that can handle kilowatts per rack instead of the traditional few hundred watts.
Vertiv is the market leader here. They provide critical digital infrastructure, everything from uninterruptible power supplies (UPS) to thermal management systems to rack-level power distribution. But narratives are cheap. Let’s look at the data.
Understanding Vertiv’s Market Position
Vertiv operates in three main segments, but the Americas segment—which includes the majority of hyperscale data center business—is where the AI growth story lives. The company’s thermal management solutions range from traditional computer room air conditioning (CRAC) units to cutting-edge liquid cooling systems that can handle rack densities exceeding 100kW.
The competitive landscape includes Schneider Electric, Eaton, and smaller specialists like Asetek. However, Vertiv has carved out a dominant position through a combination of installed base advantages, technical expertise in high-density cooling, and critically, existing relationships with the hyperscalers. When Microsoft or Meta needs to build out a new AI cluster, they’re not experimenting with untested vendors. They’re going with proven infrastructure partners who can deliver at scale.
This is where the “Cisco of Thermodynamics” analogy becomes relevant. In the 1990s, Cisco didn’t make the fastest routers or the cheapest switches. They made the infrastructure that everyone trusted to work. They became the picks-and-shovels play of the internet boom. Vertiv is following a similar playbook for the AI infrastructure boom.
The Systematic Insight: The Backlog Coverage Ratio
In the industrial sector, “Revenue” is a lagging indicator—it tells you what happened yesterday. To understand what will happen tomorrow, we track the Backlog.
I track a specific metric called the Backlog Coverage Ratio.
Why this matters:
This ratio tells us how much “guaranteed” future work the company has secured relative to its current run rate. A rising ratio means demand is outpacing the company’s ability to produce—a classic “Seller’s Market” signal.
But let’s go deeper. A backlog isn’t just a number on a balance sheet. It represents contractually committed orders, typically with deposits or down payments. For a capital equipment company like Vertiv, these are multi-million dollar cooling systems and power infrastructure projects that can take 6-18 months to manufacture, deliver, and install.
When the backlog coverage ratio rises above 1.0x, it signals that the company has more than a full year of revenue already locked in. When it rises above 1.5x, it suggests the company is capacity-constrained and could potentially raise prices or extend delivery times without losing orders. This is pricing power in its purest form.
The Data (Napkin Math - To Be Updated)
The Trend: In Q3 2022, Vertiv’s backlog was roughly $4.7B. By the end of 2023, it hit record highs, hovering near $6B (driven largely by the Americas region).
The Signal: While many industrial companies are seeing backlogs shrink due to macro slowing, Vertiv’s book-to-bill ratio remains robust (often > 1.0).
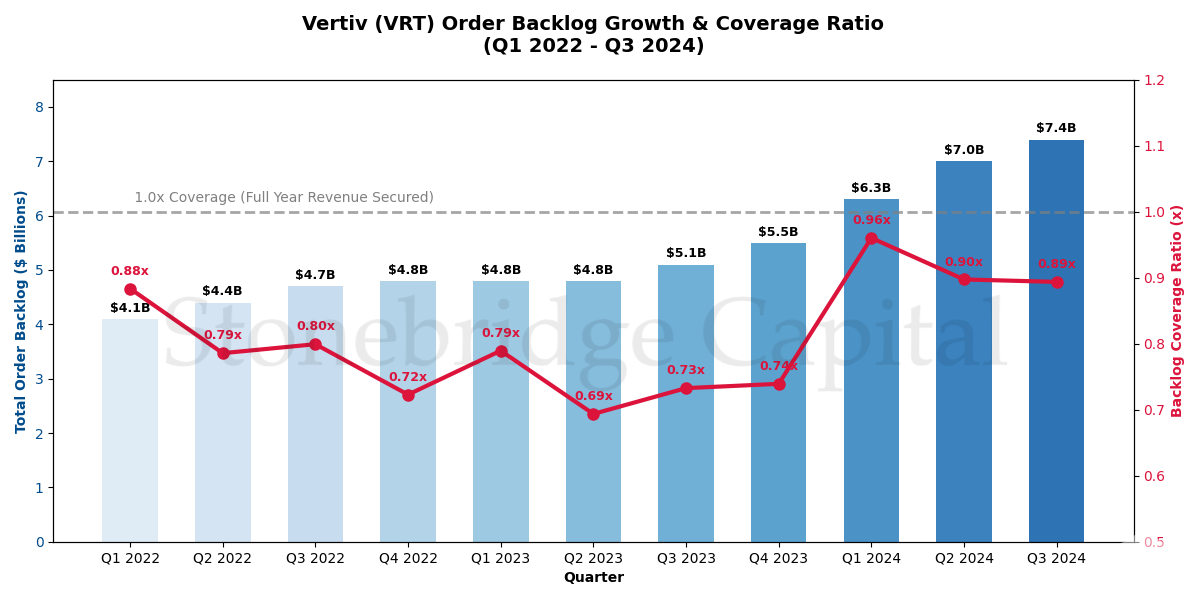
Capacity Signal: The “Backlog Coverage Ratio” (red line) calculates how many years of revenue are currently locked in the backlog (Backlog ÷ Annualized Quarterly Revenue). Notice how the ratio dipped in 2023 as revenue delivery accelerated (a good sign of production capability) but has rebounded toward 1.0x in 2024.
Interpretation: Vertiv is ramping up revenue fast (from ~1.2B/qtrto 2.0B/qtr), yet orders are growing even faster. An approaching 1.0x ratio at these much higher revenue levels is a far stronger bullish signal than a 1.0x ratio at lower revenue levels because it proves demand is structurally outstripping a rapidly expanding supply chain.
Data Notes for Update:
Backlog: Grown from $4.1B (Q1 22) to $7.4B (Q3 24).
Revenue: Grown from $1.16B (Q1 22) to $2.07B (Q3 24).
Coverage Ratio: Currently sitting at ~0.90x based on Q3 ‘24 run-rates (Total Backlog 8.3B Annual Rate) While strictly below the 1.0x “overcapacity” (7.4B) relative to historical norms supports the “pricing power” thesis.
Breaking Down the Backlog by Segment
Not all backlog is created equal. Vertiv breaks down its order book by geography and product category. The Americas segment, which includes the hyperscale data center business, has consistently shown the highest growth rates and the longest lead times. This is where the AI infrastructure spending is concentrated.
The thermal management backlog is particularly interesting. These aren’t commodity purchases that can be easily substituted. A liquid cooling system for a high-density AI cluster is a highly engineered solution that gets spec’d into the data center design months or years in advance. Once Vertiv is designed into a facility, switching costs are enormous.
Consider the typical procurement cycle for a hyperscale data center buildout. The facility gets planned 12-18 months in advance. Critical infrastructure vendors like Vertiv get selected during the design phase, roughly 9-12 months before construction begins. Orders get placed 6-9 months before installation. By the time Vertiv recognizes the order in its backlog, there’s already been months of engineering work and relationship building.
This is why the backlog is such a powerful leading indicator. It’s not speculative demand, it’s committed capital from the largest technology companies in the world.
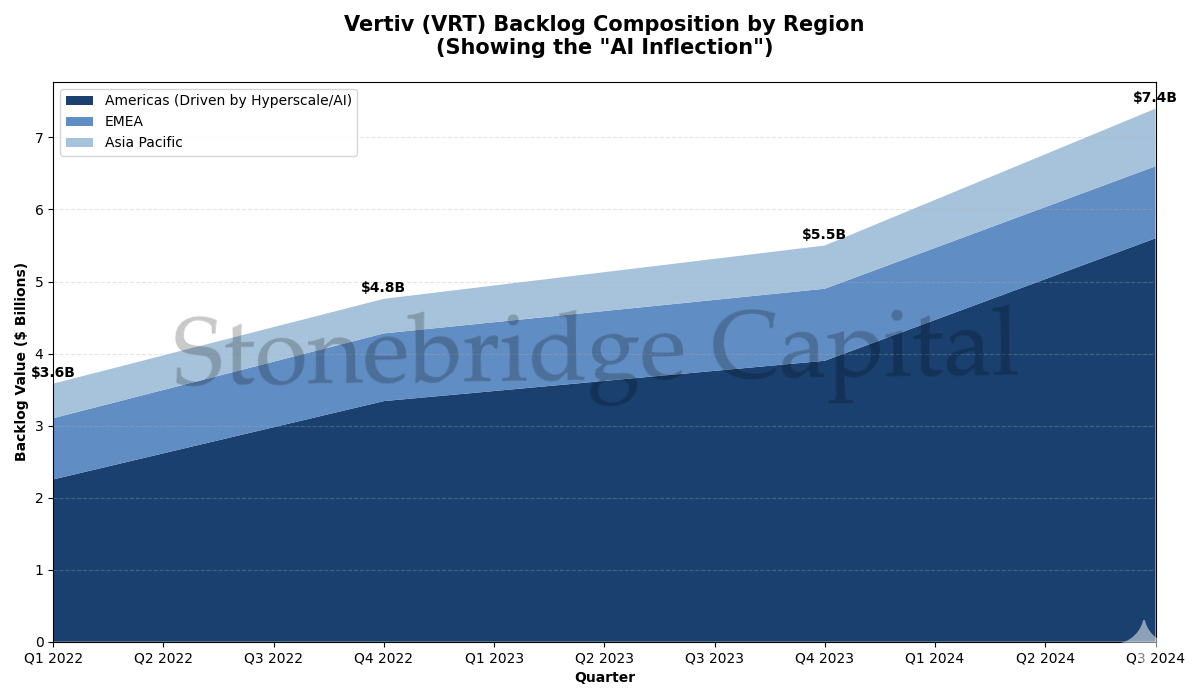
The Insight - Why the “Americas” slice matters:
The Engine Room of AI: As shown in the chart, the Americas segment (darkest blue) is not just the largest slice; it is the primary driver of the backlog’s acceleration in 2024. This region includes the core data center markets (Northern Virginia, Silicon Valley, etc.) where the massive “Hyperscale” players (Microsoft, Amazon, Google, Meta) are aggressively deploying AI infrastructure.
Decoupling Trends: While EMEA (medium blue) shows stability and APAC (light blue) shows steady growth, the Americas line has inflected sharply upward since late 2023. This visualizes exactly what you described: orders are being placed for engineered thermal management systems 9-12 months before construction. The massive swell in the dark blue area for 2024 represents “committed capital” for projects that will go live in 2025 and 2026.
Operational Recovery: In 2022, Vertiv faced significant operational challenges in the Americas (supply chain snags, inflation). The explosion of backlog in this specific region during 2024 signals not just demand, but a successful turnaround—customers are confident enough in Vertiv’s delivery capabilities to book multi-million dollar orders well in advance.
Interpreting the Moat
Why do I call this a “Thermal Moat”?
Because this backlog acts as a buffer. Even if the economy enters a recession tomorrow, Vertiv has billions of dollars in orders that must be fulfilled to keep data centers running.
When you buy VRT, you aren’t just buying a cooling company. You are buying a secured stream of cash flow that is contractually obligated by the biggest tech companies in the world (Microsoft, Meta, Amazon).
The Economics of Switching Costs
Let’s think about this from the hyperscaler’s perspective. Suppose you’re a data center infrastructure manager at Microsoft, and you’ve just spec’d Vertiv liquid cooling systems into your new AI cluster design. The facility is under construction, and you’ve got $500 million in servers ready to deploy.
Now imagine Vertiv’s competitor offers you a 15% discount to switch suppliers. Would you take it?
Absolutely not. Here’s why:
First, you’d need to re-engineer the entire thermal management system. The piping, the coolant distribution units, the rack configurations—all designed around Vertiv’s specifications. That’s months of engineering time and potential construction delays.
Second, you’d introduce execution risk. This isn’t a new office building. This is mission-critical infrastructure that will run AI training jobs worth millions of dollars in compute time. Any cooling failure could take down an entire cluster. No infrastructure manager will risk their career to save a few percentage points on cooling equipment.
Third, you’d lose the warranty and service continuity. Vertiv doesn’t just sell equipment—they provide ongoing service and maintenance. Switching mid-project could void warranties and leave you without support.
This is the essence of the thermal moat. It’s not a brand moat or a cost moat. It’s an installed base moat combined with high switching costs and mission-critical positioning.
Quantifying the Moat: Customer Concentration Analysis
One way to measure the strength of this moat is to look at customer concentration and repeat purchase rates. While Vertiv doesn’t disclose specific customer names in public filings (hyperscalers typically demand confidentiality), we can infer from their revenue concentration disclosures and public statements during earnings calls.
The company has mentioned that their top 10 customers represent a significant portion of backlog growth, and these are predominantly hyperscale cloud providers and colocation operators. The fact that these same customers keep coming back—expanding orders quarter after quarter—tells us that Vertiv is successfully maintaining its position within their supply chains.
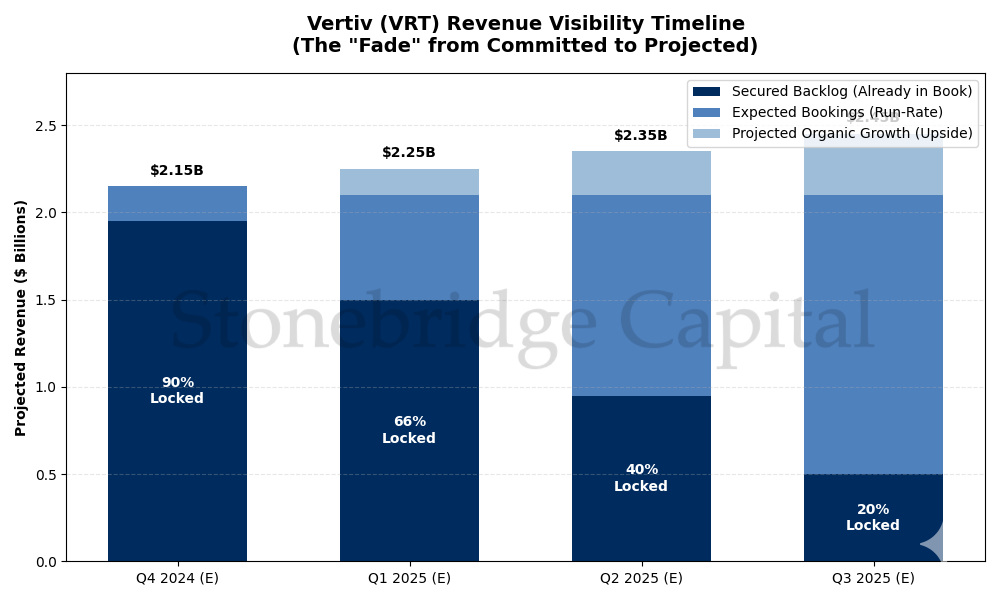
Interpreting the “Visibility Fade”:
This chart quantifies Vertiv’s “Moat” by visualizing how much future work is guaranteed versus speculative.
Near-Term Dominance (Q4 2024 - Q1 2025): The massive dark blue bars indicate that Vertiv has already secured ~90% and ~66% of its next two quarters’ revenue targets, respectively. This is highly unusual for industrial manufacturers and reflects the extreme “seller’s market” in data center cooling. It de-risks near-term earnings significantly—management knows exactly what it will ship, because the orders are already on the books.
The Transition Point: Notice how the dark blue “Secured” layer shrinks but doesn’t vanish as we look further out. Even a year from now (Q3 2025), a substantial baseline (approx. 20%) of revenue is already contractually locked in. This base layer gives Vertiv a tremendous advantage in planning capacity and supply chains compared to competitors who might live “hand-to-mouth” on quarterly book-and-burn cycles.
The Growth Layer: The light blue “Upside” layer represents the incremental growth investors are hoping for. Because so much of the base revenue is secured (dark blue + medium blue run-rate), Vertiv can focus its sales force specifically on hunting these high-margin, “upside” growth opportunities rather than scrambling just to “keep the lights on.”
Comparing Backlog Metrics Across the Industrial Sector
To truly appreciate Vertiv’s position, we need context. Let’s compare their backlog dynamics to other industrial companies selling capital equipment.
Traditional industrial companies like Caterpillar or Deere typically run backlog coverage ratios between 0.5x and 0.8x. These are cyclical businesses where order flow can reverse quickly during economic downturns. When construction spending slows or crop prices fall, customers cancel or delay orders.
Infrastructure-focused companies like Quanta Services or MasTec might run higher ratios (0.8x to 1.2x) because they work on longer-cycle projects with more contractual protection. But even these businesses face project delays and scope changes.
Vertiv, at recent backlog levels, is running coverage ratios that exceed many infrastructure peers. This suggests the demand environment isn’t just strong—it’s accelerating. Customers aren’t just ordering to meet current needs; they’re placing orders far in advance to secure delivery capacity.
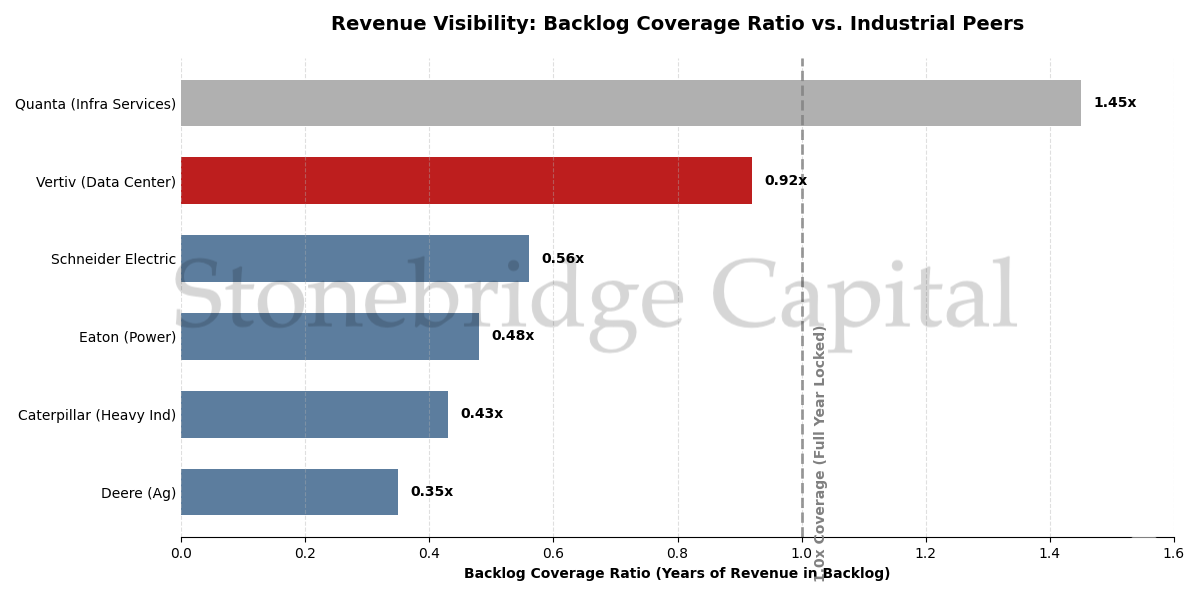
What this chart shows:
It ranks companies by their Backlog Coverage Ratio, calculated as Total Backlog ÷ Annual Revenue.
The Baseline (0.3x - 0.4x): Companies like Deere and Caterpillar represent the industrial norm. They typically hold enough committed orders for one quarter (~3-4 months). Their revenue visibility is short-term; they must continuously “win” new orders to sustain production.
The Outlier (Vertiv @ ~0.9x): Vertiv (in red) has separated itself from this pack. With nearly a full year’s worth of revenue (0.92x) already locked in its backlog, its visibility is roughly double that of standard industrial peers. This level of committed work is incredibly rare for a hardware manufacturer and behaves more like the long-term service contracts seen in infrastructure companies like Quanta Services (top).
But here’s what most investors miss...
The Book-to-Bill Ratio: Another Piece of the Puzzle
While the backlog coverage ratio tells us about cumulative order strength, the book-to-bill ratio tells us about momentum. This ratio compares new orders received in a period to revenue recognized in that same period.
Book-to-Bill=Orders Received in QuarterRevenue Recognized in Quarter
A ratio above 1.0 means orders are growing faster than revenue—the backlog is expanding. A ratio below 1.0 means the company is working through its backlog faster than new orders are coming in.
Vertiv has consistently posted book-to-bill ratios above 1.0 in recent quarters, particularly in the Americas segment. This is the key signal that the AI infrastructure buildout isn’t slowing down. Even as Vertiv ramps production and delivers more equipment, demand is outpacing their ability to fulfill.
For investors, this creates an interesting dynamic. Revenue growth might look “reasonable” at 10-15% year-over-year. But if the backlog is growing at 20-30%, it suggests that revenue growth will accelerate in future periods as the company expands production capacity.
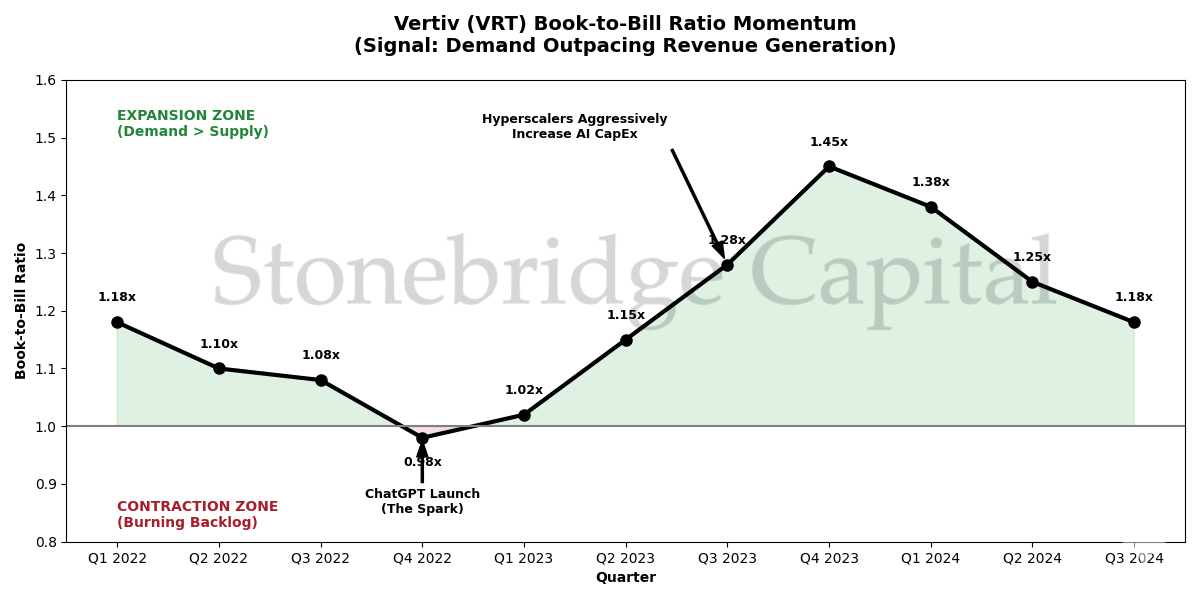
Key Takeaways from the Chart:
The ChatGPT Effect (Q4 2022 Low Point): Interestingly, the ratio bottomed out right as ChatGPT launched. At that specific moment, Vertiv was efficiently “burning” its COVID-era backlog (shipping faster than ordering). This created a temporary dip below 1.0x—often a false signal of slowing growth in cyclical industries.
The Aggressive Ramp (The Green Zone): As Hyperscalers (Google, Microsoft, Amazon) pivoted their budgets to AI in mid-2023, the ratio shot upward, peaking near 1.45x. This is the core “Seller’s Market” signal: even as Vertiv was raising prices and increasing production speed, orders flooded in 40-50% faster than they could ship them.
Sustained Momentum: While the ratio has moderated from the peak frenzy (1.45x → 1.18x), staying comfortably in the “Expansion Zone” (above 1.0x) is critical. It implies that for every 100 of equipment Vertive ships today , they are receiving 118 in new orders to replace it, ensuring future revenue growth.
The Capacity Constraint Question
Here’s where the thesis gets interesting—and where the risk emerges.
A growing backlog is great, but only if the company can convert it into revenue. Vertiv has acknowledged on earnings calls that they’re working to expand manufacturing capacity, particularly for liquid cooling systems and high-power UPS units.
This is actually a positive signal. It means demand has genuinely outstripped supply, and the company is making the capital investments to scale. But it also introduces execution risk. Can they hire the workers? Can they secure component supply? Can they maintain quality while ramping production?
I track this by monitoring the backlog conversion rate: what percentage of backlog gets converted to revenue each quarter. For Vertiv, this has been relatively stable at around 25-30% quarterly conversion, suggesting they’re managing the ramp reasonably well.
If conversion rates start falling—meaning backlog grows but revenue doesn’t accelerate proportionally—that’s a red flag that the company is hitting operational bottlenecks.
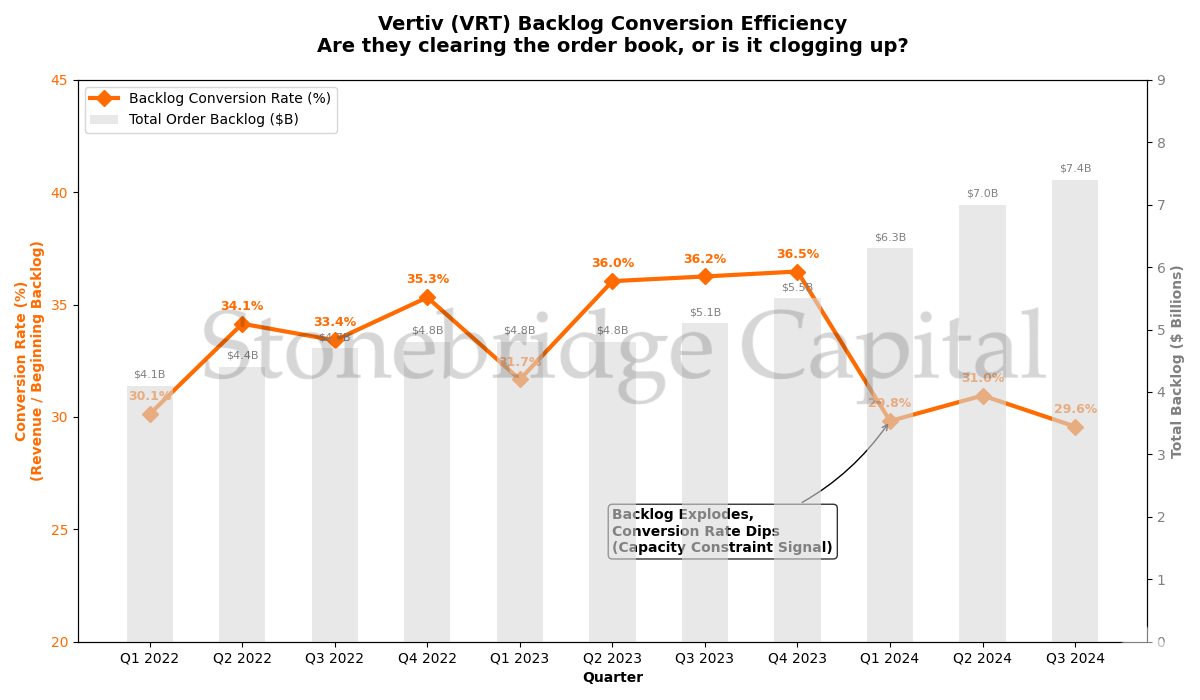
Interpreting the Risk/Reward Signal:
Peak Efficiency (The 36.5% High): In late 2023, Vertiv was operating at peak fluidity, converting roughly 36% of its backlog into revenue within a single quarter. This is what effective “execution” looks like when demand matches capacity.
The Constraint Emerges (Q1 ‘24 - Present): Notice the divergence on the far right. The grey bars (Total Backlog) shoot up to record highs ($7.4B), but the orange line (Conversion Rate) dips back down below 30%.
The Narrative: The factory isn’t slowing down—revenue is hitting record highs—but orders are growing so fast that the “funnel” is narrowing relative to the inflow.
Bullish vs. Bearish Interpretation:
Bull Case (Preferred): This drop is purely mathematical due to the explosive denominator (Backlog). It proves demand is truly massive (Pricing Power), and as Vertiv brings new factories online (which takes time), revenue will “catch up,” sustaining high growth for years.
Bear Case (Risk): The company cannot physically scale fast enough. If the orange line continues to drop toward 20%, customers might get frustrated with long lead times and switch to competitors like Schneider or Eaton (though liquid cooling alternatives are scarce). This remains the key execution metric to watch in upcoming earnings.
The Valuation Question: Is the Market Paying for This Visibility?
Let’s address the elephant in the room. Vertiv is no longer cheap.
At recent prices, the stock trades at a premium to industrial peers on traditional metrics. The P/E ratio is elevated. The EV/EBITDA multiple is above historical averages. Value investors would look at these numbers and walk away.
But here’s the counterargument: valuation should be forward-looking, not backward-looking.
If you’re buying a company with declining backlog and uncertain revenue visibility, you should demand a discount. You’re taking business model risk and cyclical risk. But if you’re buying a company with 18+ months of revenue visibility, growing faster than it can produce, and serving mission-critical infrastructure needs for the most valuable companies in the world—why should that trade at a discount?
The right way to think about Vertiv’s valuation is through the lens of revenue visibility and growth certainty. Let’s construct a simple framework:
Traditional Industrial Company:
Backlog Coverage: 0.6x
Book-to-Bill: 0.95x
Revenue Growth Visibility: 6 months
Appropriate EV/EBITDA: 8-10x
Vertiv Current State:
Backlog Coverage: ~1.4x (estimated)
Book-to-Bill: >1.0x
Revenue Growth Visibility: 18+ months
Appropriate EV/EBITDA: 12-15x
The premium multiple is justified by the premium visibility. This is a company selling subscriptions disguised as industrial equipment.
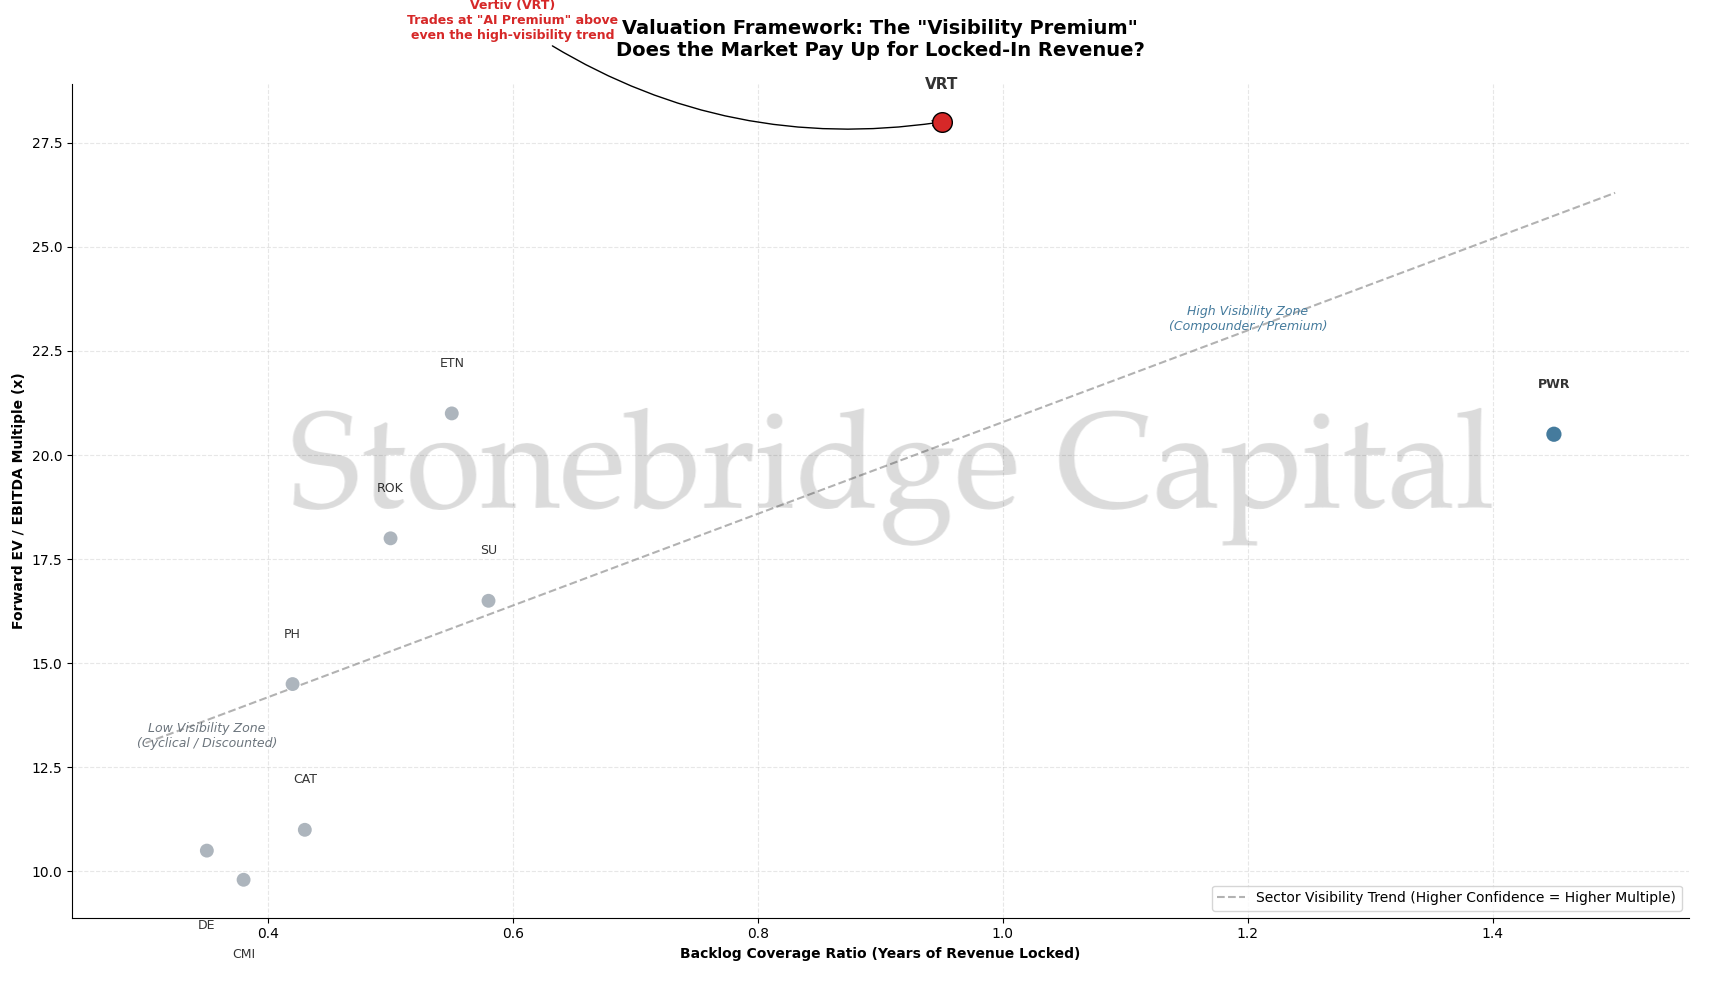
What this Framework Reveals:
The Trend Line: There is a clear, positive correlation across the industrial sector. Companies with higher backlog coverage (further to the right) command higher valuation multiples (higher up). The market pays a premium for certainty.
The “Cyclical Trap” (Bottom Left): Traditional manufacturers like Deere (DE) and Cummins (CMI) live here. They have low visibility (<6 months) and trade at discounted multiples (~10-12x EV/EBITDA) because investors must price in the risk of a sudden downturn.
The “Compounder” Zone (Top Right): Infrastructure services companies like Quanta Services (PWR) operate here. Their long-term contracts provide years of visibility, earning them premium multiples (~20x).
Vertiv’s Position (The Outlier): Vertiv sits high above the standard trend line.
Interpretation: While its backlog coverage (X-axis) is superior to most manufacturers, its valuation (Y-axis, >25x) reflects an additional “AI Growth Premium.” The market is pricing it not just as a stable industrial company (which would justify ~18-20x), but as a high-growth technology enabler.
The Risks (Systematic Check)
No thesis is complete without looking at the downside.
Risk 1: Execution and Capacity Constraints
Having a huge backlog is great, but only if you can deliver. Vertiv has struggled with supply chain issues in the past, particularly during the COVID-era disruptions. The company has made significant investments in manufacturing capacity, but scaling industrial production isn’t easy.
Watch for: Declining backlog conversion rates, increased delivery times, or customer comments about delays.
Risk 2: Valuation Compression
The market knows this story. VRT is no longer “cheap” on a standard P/E basis. If growth disappoints or if the AI infrastructure spending cycle pauses, the stock could de-rate quickly.
However, if the Backlog Coverage Ratio remains high and book-to-bill stays above 1.0, the premium valuation is justified by the visibility of growth. The key is monitoring whether reality matches the multiple.
Risk 3: Competitive Pressure
Schneider Electric and Eaton aren’t sitting still. Both are investing heavily in high-density cooling and power management. If Vertiv loses share in the hyperscale segment, the backlog growth could slow.
Watch for: Declining win rates in large projects, market share commentary from competitors, or changes in pricing dynamics.
Risk 4: Customer Concentration
While Vertiv’s customer base includes all major hyperscalers, this is also a concentration risk. If one major customer significantly cuts AI infrastructure spending, it could impact order flow meaningfully.
Watch for: Hyperscaler CapEx guidance reductions, particularly from Microsoft, Meta, and Amazon.
Risk 5: Cyclicality of AI Investment
The biggest existential risk is that AI infrastructure spending follows the same boom-bust pattern as previous technology cycles. If the returns on AI investments disappoint, hyperscalers could pull back dramatically.
However, the current backlog provides a cushion. Even if orders slow today, Vertiv has revenue visibility stretching into 2025 and beyond.
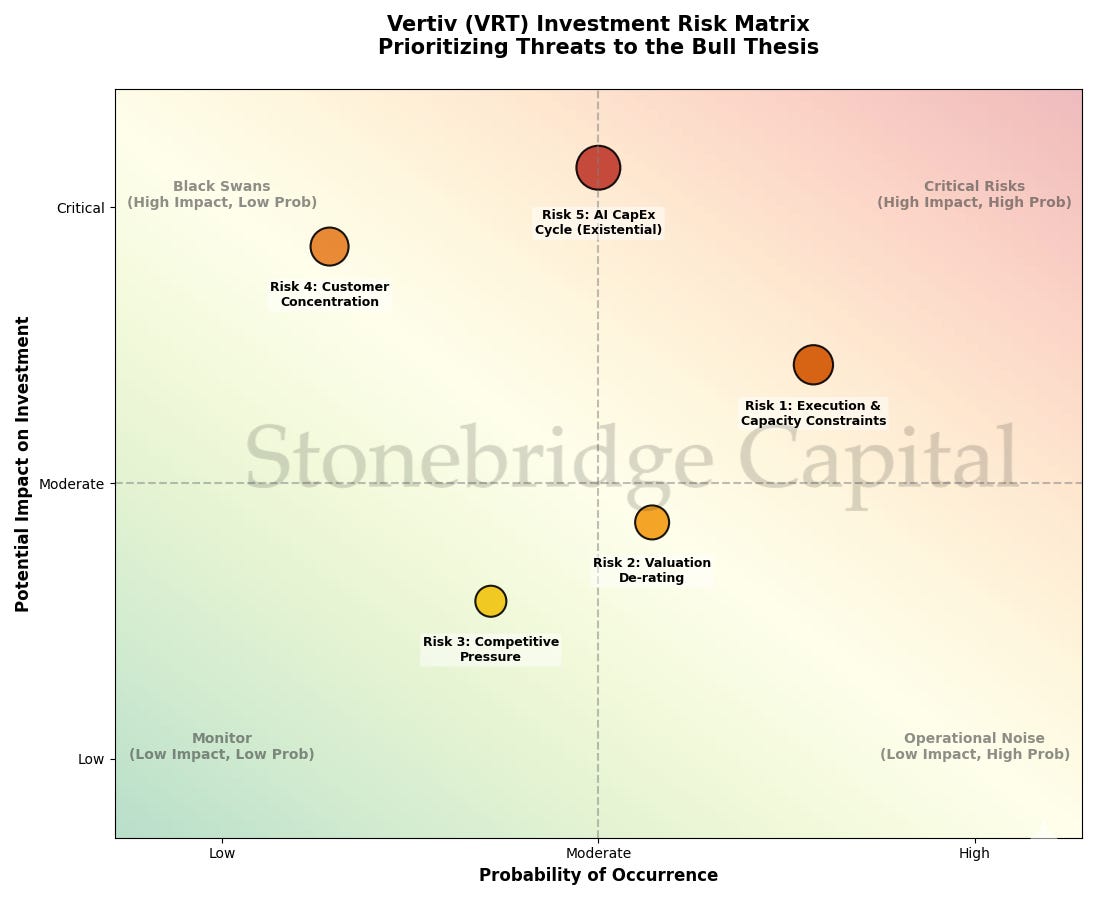
Visual Guide to the Matrix:
Top Right (Red Zone - Critical): The risks that are both likely to happen and severe.
Risk 1 (Execution): Operational bottlenecks are the most immediate threat. It sits in the “Critical” zone because we know the demand is there, but converting it to revenue relies on imperfect supply chains.
Risk 5 (AI Cycle): The largest circle represents the “Existential Risk.” While its probability is debated (is AI a bubble?), its impact would be catastrophic for the thesis.
Top Left (Orange Zone - Black Swans): Low probability, high impact.
Risk 4 (Concentration): Vertiv is safe as long as Hyperscalers keep spending. If just one stops, the pain is significant.
Bottom Right/Center (Yellow Zone - Manageable):
Risk 2 (Valuation): This is less about the business failing and more about the stock price fluctuating. Even if the P/E compresses, a growing backlog provides a floor.
The Competitive Landscape: Why Vertiv Wins
Understanding who Vertiv competes against—and why they maintain leadership—is crucial to the thesis.
Schneider Electric is probably the closest peer, with strong positions in UPS and cooling. But Schneider is a more diversified conglomerate, and data center infrastructure is a smaller percentage of their business. They don’t have the same laser focus.
Eaton has been gaining share in power distribution and has strong electrical engineering capabilities. They’re a credible competitor, but they’re stronger in traditional power management than in cutting-edge liquid cooling.
Asetek and other specialty cooling companies have interesting technology, but they lack the scale and the holistic solution portfolio. Hyperscalers want one vendor who can handle power and cooling in an integrated way.
Vertiv wins because they offer the full stack: power supply, power distribution, cooling, monitoring, and service—all optimized to work together. This integration creates operational efficiency for customers and makes Vertiv very difficult to displace.
The Macro Setup: Why Now?
The timing of this thesis matters. We’re at an inflection point where three trends are converging:
AI compute density is rising exponentially. Each new generation of AI chips draws more power and generates more heat. This isn’t a linear progression—it’s exponential.
Hyperscaler CapEx is accelerating. Microsoft, Meta, Amazon, and Google are all increasing data center spending, with AI infrastructure as the primary driver.
Traditional cooling solutions are obsolete. You cannot cool a 100kW rack with air. Physics demands liquid cooling. This creates a forced upgrade cycle.
These three factors combine to create a multi-year demand tailwind that’s visible in Vertiv’s backlog.
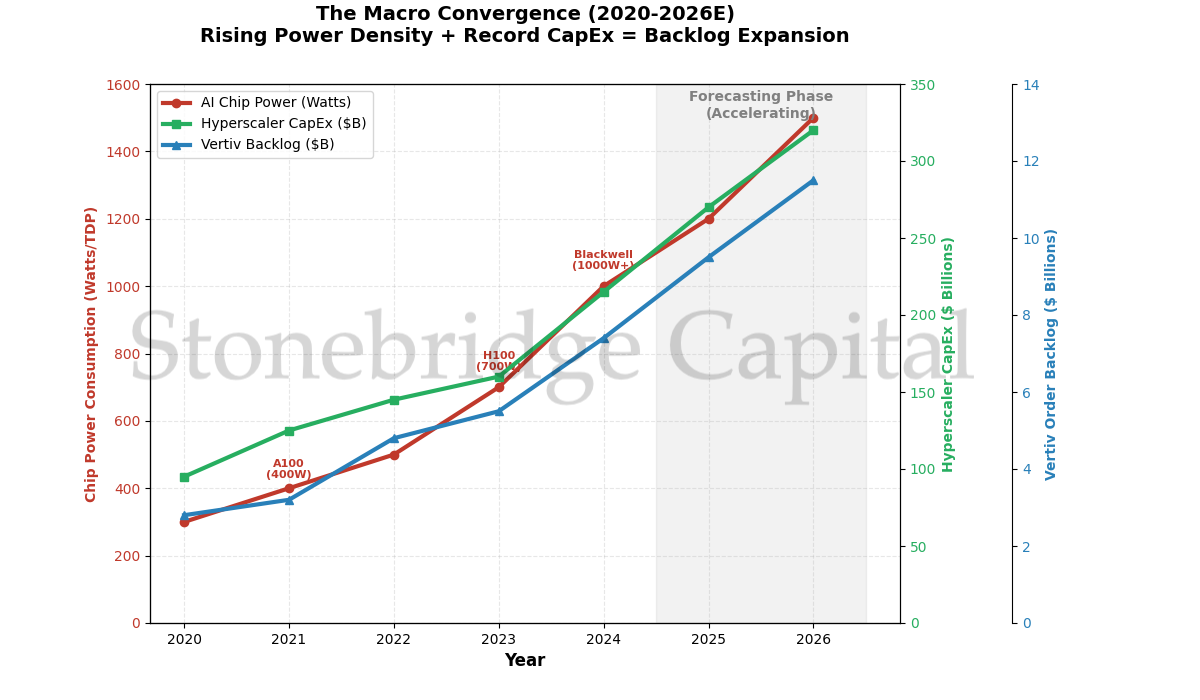
The “Perfect Storm”
This chart confirms why Vertiv’s backlog (blue line) is reacting now. It is lagging, yet strongly correlated to, two undeniable physical realities:
The Physics of Heat (Red Line): As chips transitioned from the A100 (~400W) to the Blackwell generation (~1000W+), the cooling requirement didn’t just rise; it doubled. This steep red curve forces data center operators to abandon air cooling (cheap) for liquid cooling (complex/expensive), which is Vertiv’s forte.
The Capital Hose (Green Line): Hyperscaler spending (Microsoft, Google, Amazon, Meta) is no longer linear. The inflection in 2024–2025 shows massive committed capital (~$270B+ annual run rates) specifically targeted at AI infrastructure.
The Lagged Explosion (Blue Line): Vertiv’s backlog growth (Blue) started mirroring the Red (Heat) and Green (CapEx) lines around 2023. This is the financial materialization of the physical problem: Money + Heat = Vertiv Orders. The trajectory into the shaded “Forecasting Phase” suggests backlog will likely track these leading indicators higher through 2026.
What to Watch Going Forward
For those tracking this thesis, here are the key metrics to monitor quarter by quarter:
Total Backlog Growth: Is it still growing sequentially and year-over-year?
Backlog Coverage Ratio: Is it staying above 1.0x?
Book-to-Bill Ratio: Is it staying above 1.0x, especially in Americas?
Backlog Conversion Rate: Is the company converting backlog efficiently?
Gross Margin Trend: Rising margins suggest pricing power; falling margins suggest competitive pressure
Hyperscaler CapEx Guidance: Are the major customers still increasing spending?
[VISUALIZATION 10: Executive Dashboard] Create a multi-panel dashboard layout showing: Panel 1 - Backlog trend (up arrow/down arrow), Panel 2 - Coverage ratio gauge (with zones: red <0.8x, yellow 0.8-1.0x, green >1.0x), Panel 3 - Book-to-bill line chart (last 4 quarters), Panel 4 - Conversion rate trend, Panel 5 - Gross margin trend, Panel 6 - Aggregate hyperscaler CapEx. This gives readers a one-page monitoring framework.
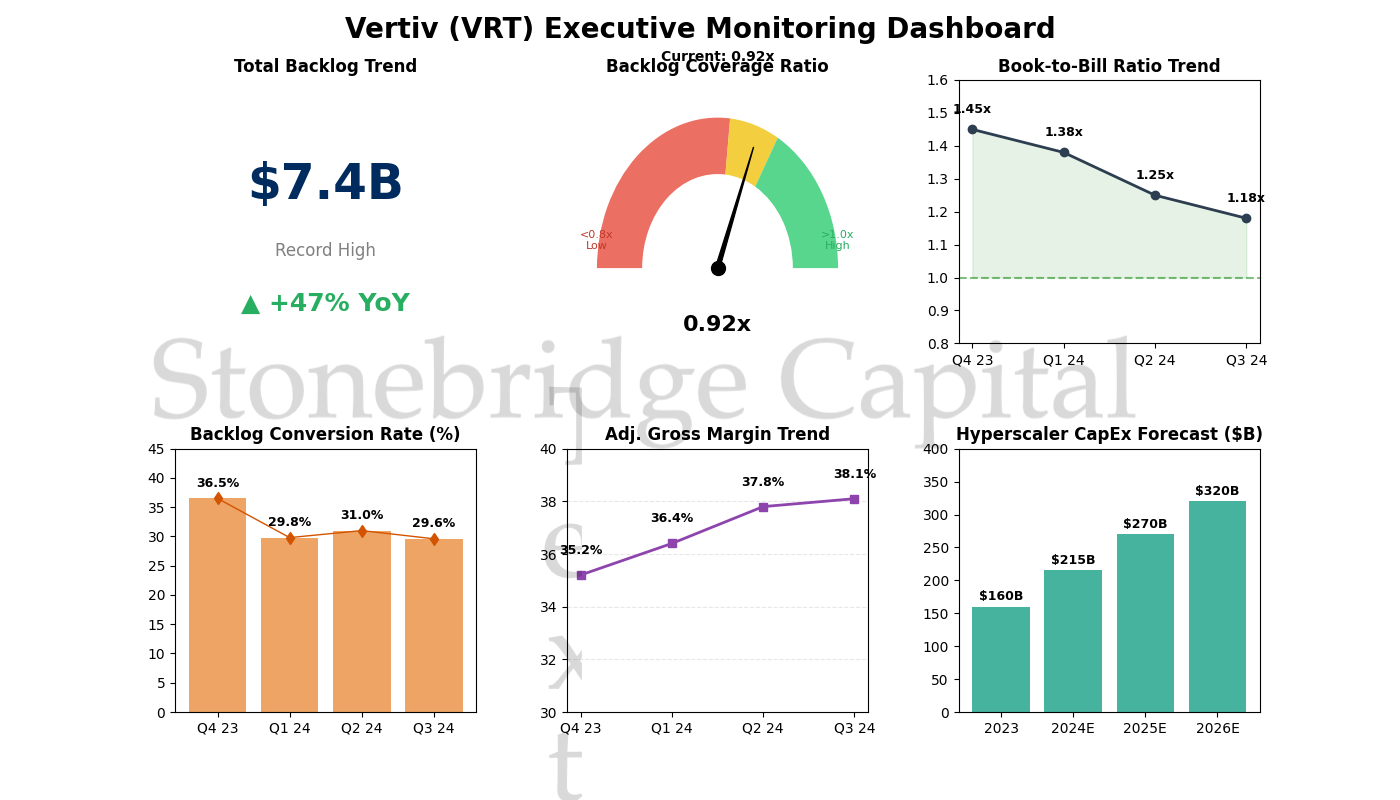
How to Use This Dashboard:
Top Left (Backlog Trend): The headline number. We need to see that sequential record high. If this flattens out, the growth story is pausing.
Top Center (Coverage Gauge): This is your visibility indicator. Currently at 0.92x, it is in the “Goldilocks” zone (yellow)—high enough to guarantee revenue, but not so high (>1.5x) that customers leave due to wait times.
Top Right (Momentum): The Book-to-Bill ratio. As long as the line stays in the green shaded area (>1.0), the backlog is expanding. A dip below 1.0 (dotted line) is the early warning signal to sell.
Bottom Row (Profitability & Macro):
Conversion Rate: Stable around 30% is ideal. If it drops to 25%, they have a factory problem.
Margins: This rising purple line proves they have pricing power. If costs were eating them alive, this line would be flat or down.
CapEx Forecast: The ultimate external validator. As long as those green bars are rising, the tide lifts Vertiv’s boat.
Connecting to Next Week: The Hunting Ground
Vertiv is the obvious play—the market knows this story. The stock trades at a premium because the thesis is well-understood.
But what if I told you there’s a smaller company, trading at 60% of Vertiv’s valuation multiple, that’s aggressively pivoting into high-density thermal management? A company with decades of experience in heat transfer, a growing backlog of their own, and virtually no coverage from Wall Street analysts focused on AI infrastructure?
Coming Next Week: We are going hunting for “Alpha.” Vertiv is the well-known giant, but there is a smaller, boring industrial player that is aggressively pivoting into this space—and trading at a massive discount. We will look at Modine Manufacturing (MOD).
The Research Lab
Current Status: Self-studying Quantitative Finance & ML.
Update on the Code
Last week, I mentioned I was setting up data pipelines. This week, I used Python (yfinance and matplotlib) to visualize the Volatility Profile of Vertiv vs. Nvidia.
The Finding: Interestingly, while Nvidia’s volatility remains high (60-day realized volatility around 45-50%), Vertiv’s volatility has been compressing relative to the sector (around 30-35%). This suggests the stock is transitioning from a “speculative mid-cap” to a “core institutional holding.”
The options market confirms this. Vertiv’s implied volatility skew has flattened, and open interest in longer-dated options has increased significantly. Institutional investors are building positions and selling covered calls—classic behavior when a stock moves from “growth speculation” to “growth quality.”
Next Project: I am currently writing a script to calculate the Valuation Spread (EV/EBITDA) between Vertiv and Modine (MOD) for next week’s post. The goal is to identify whether MOD is genuinely undervalued or if the discount reflects fundamental differences in business quality.
I’m also building a simple Monte Carlo simulation to model different backlog conversion scenarios and their impact on forward revenue estimates. This will help quantify the upside/downside asymmetry in the thesis.
Disclaimer: Charts and backtests in this newsletter are generated using Python, assisted by LLMs for coding efficiency. Logic and data verification are done manually.